IQ-GDP II: Curve fitting

Systematic outliers

GDP is a flawed measure, but it is a very popular one. We choose it to represent wealth production per nation to establish continuity with preceding investigations. Of course, the mean national IQs, introduced in the last post, also correlate with GDP per capita (0.6167787349944118, p<1.4581315729112548e-16). In this post we are going to take a closer look at this relationship.

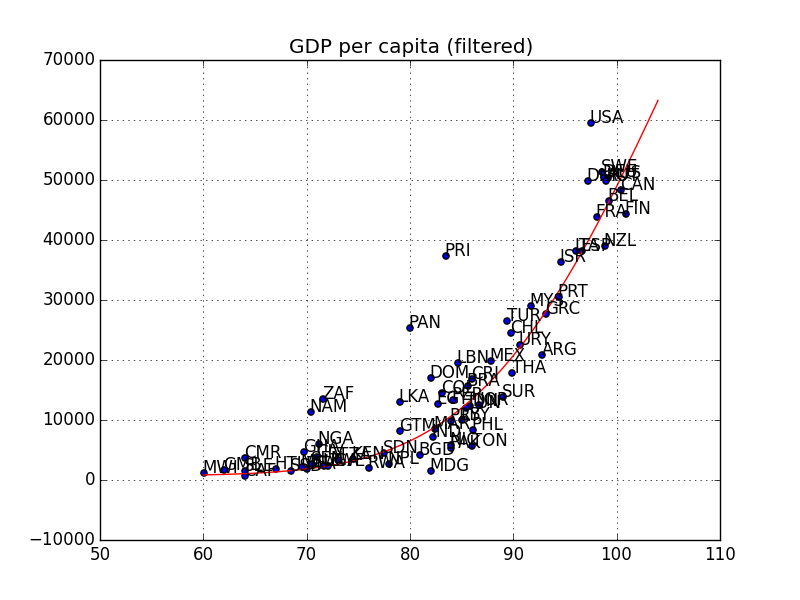
In the figure above, we can see an upward sloping curve described by the bulk of the data points. But there is also no shortage of outliers. Now, sometimes outliers are just noise and the only honest way to remove them is to get better data. Most of our outliers here are systematic. They group into countries that are biased in the same direction and for the same reason.

The gulf states (QAT,KWT,ARE,SAU,BHR,OMN) stand out with their IQ in the 80ies and very high GDP. Obviously, their high GDP is due to oil. China and several ex-communist countries are still catching up after decades of planned economy. The North-East Asian countries are too smart for their GDP. It seems to be the case that their unusually high mathematical-spatial IQ exaggerates their full-scale IQ or whatever aspect of IQ is essential for the GDP-relationship. If we wanted to get at the underlying relationship that drives that bulky upward sloping curve in its purest form, we might want to exclude countries rich in natural resources, tourism or tax haven fueled economies, (ex-)commies and the North-East Asians.

That leaves us with roughly half the countries, and we can claim that we examine the relationship between national IQ and GDP in non-North-East Asian countries, whose economy is based on the industrial production of goods in a market economy.
Here, we still see some outliers: The USA (maybe the dollar), Puerto Rico (due to being part of the US), South Africa and Namibia (we’ll see why in a later part of this series) and Panama (no idea why).

Fitting a curve and telling a story

The Pearson correlation we calculated above, assumes a linear relationship. In case of a non-linear relationship the correlation undersells the actual connection between the variables. Finding a fitting function for the curve described by our datapoints allows us to correct for that.

There are different ways to fit this curve and they come with different narratives.

La Griffe Du Lion proposes the smart fraction theory of IQ [1]. According to his theory, GDP is directly proportional to the size of the fraction of the population above a certain IQ-threshold. This theory entails that GDP gains would level off once most of the population is above the IQ-threshold. The threshold that fits our filtered data (70 countries) best is an IQ of 106. This results in a correlation between the size of the smart fraction and GDP of 0.932, p<8.15e-32.

Richard Dickerson proposes an exponential fit of the form a*10^(b*IQ) [2]. This results in a virtually identical fit with a correlation of 0.931, p<1.875e-31. The story changes somewhat, however. There is no reason to expect a leveling off of the curve and no smart fraction gets to play an essential role.

While these two ways of fitting the data come with different narratives and predictions, they both show that the IQ data explains the vast majority of the variation in GDP produced by industrial production of goods in a market economy.

I have another two competing theories how to fit the data. However, we first have to cover more important ground. In the next post, we are going to look at the question of causality.

[1] The smart fraction theory of IQ and the wealth of nations
http://www.lagriffedulion.f2s.com/sft.htm

[2] Richard E. Dickerson: Exponential correlation of IQ and the wealth of nations.
https://www.sciencedirect.com/science/article/pii/S0160289605001078

IQ-GDP I: The database

The database

In 2002 Richard Lynn and Tatu Vahanen published “IQ and the Wealth of Nations”, a book based on a database of national mean IQ scores collected from many different sources [1]. This has made a lot of people very angry and been widely regarded as a bad move.

There are a lot of studies that measure the IQ of their probands, often as only one of several indicators. A typical example would be trying to establish the adverse effects of malaria. Here, you would have a group of people afflicted with malaria and a control group representative of the population. By comparing both groups in IQ, SES, health and what-not, you can establish that malaria is a bad thing to happen to you.

Now, Lynn comes along and doesn’t give a damn about malaria. Instead he just scoops up the mean IQ of the control group, which gives him one measurement of the typical IQ of this population. However, due to the Flynn effect, you cannot easily compare IQ across time in a fair way. So if the IQ test used, was normed ten years earlier, say in the UK, you have to discount this mean IQ by the Flynn effect over ten years in the UK. This would amount to roughly -3 points and gives you a comparison of this population and the British in the year of the study in terms of IQ.

This results in a database that is easy to criticize. Many of these studies are not very carefully conducted, after all, they were never meant to create representative mean IQs of a national population. The Flynn effect is not well understood and correcting for it can seem arbitrary and a little dodgy. However, this database now exists and it is still maintained and improved by one David Becker [2] and, as we will see, it contains very interesting information.

The correlations

But how do we tell, that this offensive database is not just noise?
Well, for starters the national IQs correlate very significantly and quite strongly with

  • human development [3]: correlation 0.821, p< 1.165e-36
  • economic complexity [4]: correlation 0.789, p<1.329e-24
  • scientific output [5]: correlation 0.618, p<1.040e-17

and very significantly and negatively with

  • inequality [6]: correlation -0.481, p<1.485e-08
  • infant mortality [7]: correlation -0.809, p<2.581e-33
  • corruption [8]: correlation -0.602, p<2.136e-15

This shows that the database does not contain “just noise”. There is actual information in there, about stuff we usually care a lot about. Of course, many very different relationships can result in a correlation between two variables. Over the next posts we are going to go deep on one of these relationships: The one between national mean IQ and GDP per capita.

[1] Lynn, Vahanen: IQ and the Wealth of Nations
https://en.wikipedia.org/wiki/IQ_and_the_Wealth_of_Nations

[2] World’s IQ by David Becker
https://www.researchgate.net/project/Worlds-IQ

[3] Human Development Index
https://en.wikipedia.org/wiki/Human_Development_Index

[4] Economic Complexity Index
https://en.wikipedia.org/wiki/Economic_Complexity_Index

[5] H-Index
https://en.wikipedia.org/wiki/H-index

[6] Gini-Coefficient
https://en.wikipedia.org/wiki/Gini_coefficient

[7] Infant mortality rates
https://en.wikipedia.org/wiki/List_of_countries_by_infant_and_under-five_mortality_rates

[8] Corruption Perception Index
https://en.wikipedia.org/wiki/Corruption_Perceptions_Index

A theory of IQ: Cognitive profiles and cortical structures

In the last post we presented three mysteries, the relatively small brains of the highly intelligent Ashkenazi Jews, the scientific and economic underperformance of North-East Asian countries relative to their mean IQ (around 105), and the Flynn effect of rising IQ scores during the 20th century.

To arrive at a theory capable of resolving them, we will discuss first the Ashkenazi cognitive profile and then a simplified model of the neocortex.

The Ashkenazi cognitive profile

Freud, Einstein, Marx.

Often most impressive about famous Jewish thinkers is their ability to put a lot of different and seemingly unrelated facts into a big conceptual framework. Sometimes that results in nonsense, sometimes in pure genius, and sometimes it changes the world.

It also seems to be the driver behind the crazy percentage of Nobel prizes in economics collected be Ashkenazim. A slightly uncharitable description would be that Ashkenazim seem to have a unique ability to create just-so stories. Examples for this ability are easy to come by [1],[2],[3].

The IQ profile of Ashkenazim is unusual as well. They excel at mathematical and especially verbal tasks, though they seem to lag slightly behind other Europeans when it comes to visuo-spatial IQ [4].

The biological underpinning of these extraordinary abilities are suggested by the two big genetic disease clusters typical for Ashkenazim, one increases dendritic growth, i.e. the ability of neurons to form synapses with other neurons, the other hampers DNA repair, which is conjectured to also boost the number of synapses created in the brain [5].

This implies that the fast creation of new connections is the driver behind the high Ashkenazi IQ.

A cartoon model of the human neocortex

For the purpose of this blogpost I introduce a very simplified model of the human neocortex, the seat of human intelligence.

The cortex can be viewed as consisting of pattern recognizers, which have three kinds of input connections [6]: The feedforward input that contains the actual pattern uses only 20 percent of the dendritic connections of this pattern recognizer. The remaining 80% are distributed between lateral connections, which provide temporal context and therefore facilitate sequence learning, and feedback connections, which provide overall context.

A theory of IQ

My hypothesis is that the faster creation of lateral synapse boosts the verbal IQ of Ashkenazim, while easier creation of feedback connections allows for the conceptual and analytic excellence that distinguishes Jewish thinkers.

If this hypothesis is correct, the slightly lower verbal IQ of NE-Asians suggests a slightly lower number of synapses being created. An overall lower creation of feedback synapses would also lead to a lower ability to come up with creative conceptual theories. This ability is difficult to test and therefore doesn’t show up in the “lab”. But it is more plausible than verbal IQ to be the essential ingredient for economic and scientific success.

The full correspondence I suggest is that the number of pattern recognizers determines visuo-spatial and mathematical IQ. The number of lateral synapses corresponds to verbal ability and the top down connectivity to the ability to create new high level concepts.

But wait a second, don’t the Ashkenazim have very high mathematical IQ as well? Quite right, and they achieve that by re-purposing part of the visual cortex for higher level patterns. Basically evolution just shuffled IQ points from spatial to mathematical, by reassigning pattern recognizers.

With that last little flourish everything falls nicely into place, the IQ profiles, the brain sizes, the underperformance relative to IQ.

The Flynn effect can now be explained by brain size increase via better nutrition and fewer childhood diseases [7],[8]. This fits perfectly to a puzzling aspect of the Flynn effect, namely that the gains have been enormous on pure pattern recognition tests, like the Raven’s, while IQ tests based on sequence learning, like verbal IQ or digit span have shown little or no Flynn effect.

If the half a standard deviation bigger NE-Asian brains do a standard deviation better on spatial reasoning/maths than European brains, it is not unreasonable to assume that the increase in brain size by more than a standard deviation [7],[8] during the 20th century might account for the whole Flynn effect on the Raven’s which is more than 30 points.

Of course, the brain is lot more complicated than my simple model suggests. The hippocampus, the basal ganglia, the thalamus, etc. all likely play a essential role in human intelligence. The Flynn effect might have several additional causes, especially education seems to be a candidate that shouldn’t be neglected. However, as a very rough overview, this seems to be a useful framework.

[1] Guns, Germs and Steel
https://en.wikipedia.org/wiki/Guns,_Germs,_and_Steel

[2] Legal systems very different from ours
http://www.daviddfriedman.com/Academic/Course_Pages/legal_systems_very_different_12/LegalSystemsDraft.html

[3] Unsong
http://unsongbook.com

[4] Cognitive Style of Eastern European Jewish Males
https://journals.sagepub.com/doi/abs/10.2466/pms.1977.45.1.279

[5] Natural History of Ashkenazi Intelligence
http://web.mit.edu/fustflum/documents/papers/AshkenaziIQ.jbiosocsci.pdf

[6] Cortical Learning Algorithms
https://numenta.org/resources/HTM_CorticalLearningAlgorithms.pdf

[7] More evidence for increasing brain size over the 20th century
https://pumpkinperson.com/2018/08/25/more-evidence-for-increasing-brain-size-over-the-20th-century/

[8] Human brain growth in the 19th and 20th century.
https://www.ncbi.nlm.nih.gov/pubmed/372500

A theory of IQ: Three mysteries of IQ research

This is the first of two parts. Here, we discuss three mysteries in IQ research. In part two we will propose a theory of human intelligence that resolves them. The three mysteries are the Ashkenazi brain size-IQ outlier, the North-East Asian scientific and economic underperformance relative to their IQ, and the Flynn effect.

Brain size-IQ connection

It has long been known that brain size and IQ are correlated. Modern fMRI-studies confirm this relationship [1]. The correlation is relatively weak. However, even weak correlations can approach unity, if we average over groups and the other influences average out. Asians, Whites and Blacks sort in the same way by brain size and by IQ and the observed differences seem to very similar in terms of standard deviations [2]. Only the Ashkenazim with the highest IQ of all, fall out of that pattern, with an average brain size slightly below the white mean [3].

The Flynn effect

The Flynn effect is the phenomenon that over the 20th century IQ performances rose enormously [4]. In some types of tests this increase is more than 2 standard deviations. The Flynn effect is mysterious because we neither know what the root cause is, nor do we know what this increase means in practice. Nutrition, education, changes in worldview (“scientific goggles”) and several other causes have been proposed, it hasn’t been a slam-dunk for any of these. While the scores went up, people do not seem to be smarter than two or three generations ago.

North-East Asian underperformance

North-East Asians do pretty well. Of all groups out there, they alone have closed the gap to western levels of affluence (or in the case of China, are about to). In what way do they underperform? The mystery lies in the fact that they enjoy quite a pronounced IQ advantage compared to western nations, which doesn’t seem to translate into higher GDP or scientific output. They do well, but not as well as they should.

If we compare Japan and Germany, for instance, we find a pretty similar history: Late comers to the international stage, they went through a phase of nationalism and militarism that ultimately led to WW2 and the destruction of their countries. The countries were rebuild and quickly entered the economic elite again. This makes them ideal for a comparison that highlights the NE-Asian underperformance:

Japan enjoys an IQ advantage that is currently estimated at 6 points (105 to 99 or thereabouts). This should be enough to leave Germany in the dust when it comes to GDP. However, instead they lag behind with 38,428 vs 44,469 USD per capita.

Their population is 50% larger. Their work hours are 50% longer. Their total GDP is higher and the percentage of GDP they put into research and development is higher too [5]. Still, the Japanese lag behind the Germans in most indicators of scientific output [6].

There are several competing explanations that revolve around a lack of creativity, curiosity or testosterone [7]. Or too much conformism and hierarchy. La Griffe Du Lion proposes that it is the verbal IQ that determines GDP (and apparently scientific output) [8]. This would resolve the paradox, because while the high NE-Asian IQ depends on a very high mathematical-spatial IQ, in verbal tests they often lag slightly behind Europeans.

However, this explanation is only mathematically satisfying. Why would verbal IQ be so exclusively important? Aren’t the quantitative skills the most valuable on the labor market?

[1] Big brained people are smarter
http://www.people.vcu.edu/~mamcdani/Big-Brained%20article.pdf

[2] Estimating the genetic IQ and genetic brain size of many races
https://pumpkinperson.com/2016/12/30/estimating-the-genetic-iq-genetic-brain-size-of-many-races/

[3] Jewish brain size
https://pumpkinperson.com/2015/05/29/jewish-brain-size/

[4] The Flynn effect
https://en.wikipedia.org/wiki/Flynn_effect

[5] R&D spending by country
https://en.wikipedia.org/wiki/List_of_countries_by_research_and_development_spending

[6] Scientific output country ranking
https://www.scimagojr.com/countryrank.php?order=h&ord=desc

[7] Why do NE-Asians win so few Nobel prizes?
https://www.researchgate.net/publication/282411443_Why_do_Northeast_Asians_win_so_few_Nobel_Prizes_1

[8] Smart fraction theory 2: Why asians lag
http://www.lagriffedulion.f2s.com/sft2.htm