One of the interesting aspects of the smart fraction theory is that it explicitly provides a “contribution distribution”. This is a function, that details how much each section of the bell curve contributes to the economy. In the smart fraction theory, this function is a step function, which is zero below the threshold (IQ=106) and some constant value above zero beyond the threshold. This can obviously only be a crude approximation of the true contribution distribution.
So, what is the true contribution distribution?
We can try to approximate the true contribution distribution by splitting the IQ spectrum into several sections and finding out for each country, how big the percentage of the population in each section is. Together with the GDP values, this gives us a system of linear equations, where the sum of (percentage of the population * contribution of IQ section) = GDP, for all countries.
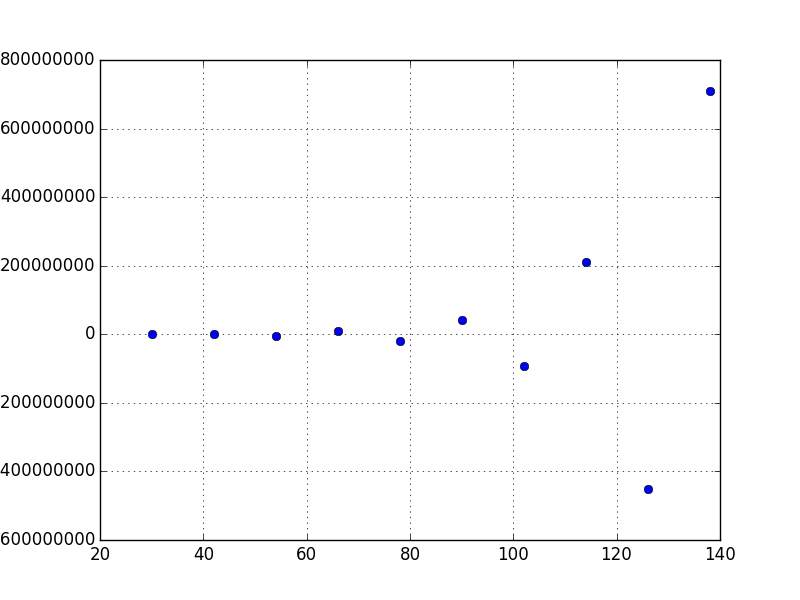
Unfortunately, solving this equation doesn’t give us a sensible contribution distribution. The smart fraction theory already showed us, that assigning a GDP value to a single IQ section is enough for an excellent fit. Giving this equation more degrees of freedom just ends up with contribution values all over the place.
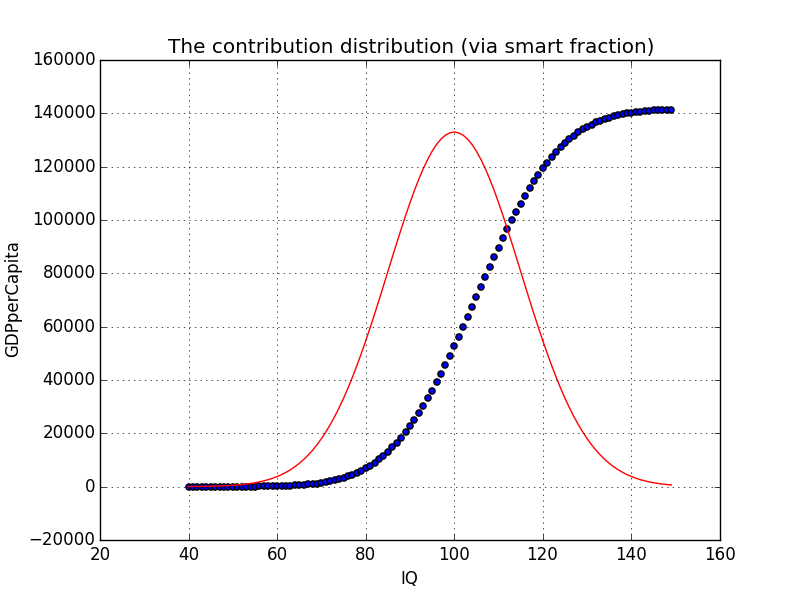
However, we can also infer the contribution distribution directly from the exponential function fitted to the data. By either using fancy math or basic logic, we conclude that the contribution distribution connected to the exponential fit, has the same form a*10^bx, with the same b but a different a, as the exponential function fitted to the data. (The fancy maths involves fourier transforms, the basic logic says that the contribution distribution has to rise as fast as the exponential fit.)
Fitting this function to the GDP data gives us the following contribution distribution:

Of course there are issues with the concept of the contribution distribution.
The contribution possible for each IQ segment will depend strongly on the overall economy. This global contribution distribution is bound to overestimate what smart people can do in poor societies and it might underestimate what not-so-smart people can contribute in rich societies.
The exponential takeoff looks somewhat insane. I stopped plotting at IQ=130, because otherwise it becomes ridiculous. A contribution distribution derived on the basis of the smart-fraction fit might be more realistic. However, at this point we do not really know the diminishing return on IQ.
It is also worth keeping in mind that the contribution of each segment is a mean average. It could very well be the case that the median contributions of each segment lie much closer to each other, and only the increasing number of massive outliers in terms of contribution results in the exponential rise.
Still, the contribution distribution is worth exploring, because it allows us to go beyond mean IQ.
