Hereditarianism I: Galton and Gaps

Hereditarianism is the idea that differences in abilities and character traits are substantially genetic in origin. This has been largely validated for individual differences, especially when it comes to IQ.

Everything is heritable. [1]

“Hereditary genius” by Francis Galton published 1869 can be seen as the founding document of hereditarianism [2]. In “Hereditary genius” Galton observes that human traits are often normally distributed, including intellectual abilities. He then proposes a method to sort people into different grades of “eminence”. The grades A, B, C, D, E, F, G, and X are above the average, getting ever more illustrious and the grades a, b, c, d, e, f, g, and x classify people below average in lifetime achievement. He gives precise frequencies for each grade, so that it is possible to translate his statements into the language of IQ. Although Galton’s “eminence” is based on more than just intelligence (he mentions “zeal” and “working capacity”) it is probably the most important aspect.

His grades correspond to the following IQs:

A >100.0
B >110.39
C >120.88
D >131.33
E >141.78
F >152.24
G >162.60
X >171.30

As we can see, each grade should roughly correspond to a range of 10.5 IQ points.

Using his grading system he then starts to analyse the pedigrees of English judges and other notable men. He finds that “eminence” runs in families, and rules out a decisive role of nuture by looking at the adopted sons of popes.

He finally goes on to assess the difference between Africans and Europeans, in essence relying on several observations of tail effects. He diagnoses an average intellectual ability gap of 2 grades, which would translate to 21 IQ points.

First, the negro race has occasionally, but very rarely, produced such men as Toussaint l’Ouverture, who are of our class F; that is to say, its X, or its total classes above G, appear to correspond with our F, showing a difference of not less than two grades between the black and white races, and it may be more.

Hereditary Genius

To Galton group differences are obviously innate, but he does see moderating environmental influences. On the Africans in Africa he says:

Thirdly, we may compare, but with much caution, the relative position of negroes in their native country with that of the travellers who visit them. … [A]n average actual difference of three grades, of which one may be due to the relative demerits of native education, and the remaining two to a difference in natural gifts.

Hereditary Genius

However, the currently existing results about the heritability of IQ differences between individuals do not automatically transfer to group differences. If there are systematic environmental differences between groups, in-group heritability could be high, but the between-group differences would be environmental. And of course there are many actual and potential systematic differences between groups. Enough, that as soon as hereditarians have disproven one potential environmental cause for group differences, two new ideas are lined up by the environmentalists. These potential causes include socio-economic status of the parents, lead exposure, number of words heard in early childhood, peer groups, stereotype threat, many aspects of education, prenatal and postnatal nutrition, breast feeding, systemic racism and many more.

Although there is no clear-cut argument for predominantly environmental IQ gaps between ethnic groups, the environmental position is the current consensus.

“Hereditary genius” is a great read, because, while his methods are pretty dodgy, Galton is basically some hundred years ahead of the curve. A true founder of the field. In the next post we are going to analyze a data set to see how well Galton’s assessment of group differences holds up or whether the current environmentalist consensus is still in decent shape.

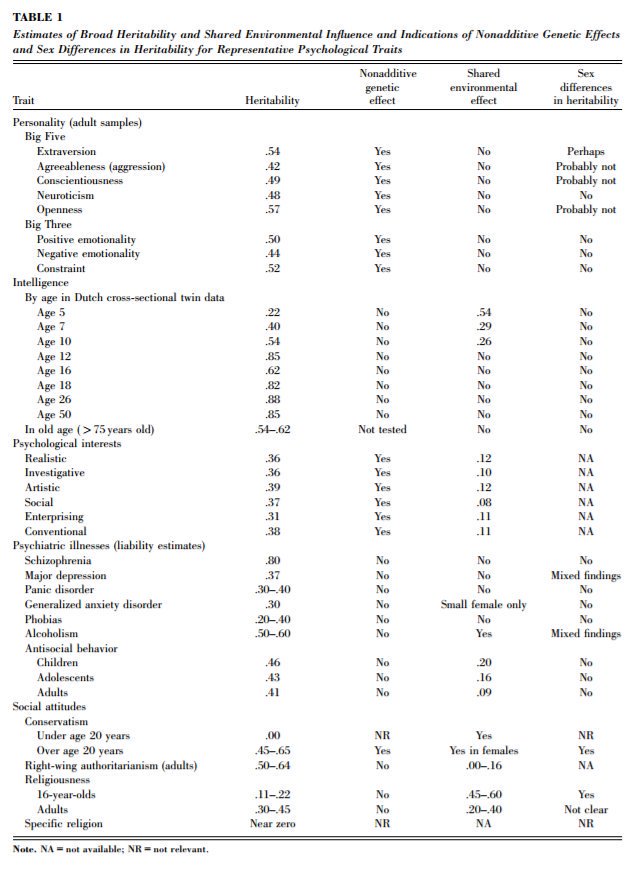
[1] Genetic influence on human psychological traits
http://humancond.org/_media/papers/bouchard04_genetic_influence_psychological_traits.pdf

[2] Hereditary Genius
http://galton.org/books/hereditary-genius/text/pdf/galton-1869-genius-v4.pdf

IQ-GDP VIII: Linear g theory

The second idea of how to interpret the GDP-IQ relationship is based on several different results of IQ research.

As you might know, there is a general factor of intelligence, that can be extracted from any battery of cognitive tests. The so-called g-factor explains a big part of the results on any IQ-test. The essential thing is that it explains the predictive part [1]. That means if you factor out the g-factor, IQ tests do no tell you much about educational attainment, income, criminality or performance in other cognitive domains.

As you might further know, there has been a steady rise of IQ scores, called the Flynn effect [2]. However, the Flynn effect has not been on the g-factor. I.e. the Flynn effect has been anti-correlated with the g-loadings of different IQ tests. This explains why our grandparent’s generation does not seem to be morons, despite scoring 30 points lower on Raven’s matrices. The Flynn effect doesn’t really increase cognitive ability, rather it increases the additional factors that unfortunately do not generalize.

As the Flynn effect is still ongoing in many countries and has stopped in the most developed countries, it is obviously playing a role in the differences in national mean IQ. If one day all countries have reached the end of the Flynn effect, we would expect the differences in mean IQ to have decreased substantially.

But here comes the rub: If the differences decrease due to the Flynn effect, and the Flynn effect is not on g, and only g is predictive of performance in the real world … why would we expect the shrinking IQ gap to be accompanied by a shrinking performance gap in GDP and co?

The linear g theory says that if we could compare nations by g-factor instead of IQ, we would see a linear relationship between g and GDP. The exponential relationship observed between IQ and GDP is just an artifact of poorer countries having still a lot of Flynn left to go.

This figure illustrates the linear g theory: The developed countries have IQs close to their g-factor, everybody else is still catching up. The relationship between g and GDP is linear.

I do not endorse a strong version of the linear g theory. But given the results of IQ research cited above, the hollowness of the Flynn effect must play some role in distorting the IQ-GDP relationship.

[1] g-factor
https://en.wikipedia.org/wiki/G_factor_(psychometrics)#Practical_validity

[2]Flynn effect
https://en.wikipedia.org/wiki/Flynn_effect

IQ-GDP VII: Three section theory

I also want to put another two competing theories out there. Both are based on the idea, that despite all appearances, the relationship between GDP and national IQ is a linear one.

The first theory decomposes the data into three sections: The pre-industrial section with IQs below 80. The middle income trap with IQs between 80 and 95 and the developed world with IQs above 95.

The idea is that each of these sections has it’s own specific IQ-GDP relationship. In pre-industrial countries this relationship is quite weak, a linear fit with minimal slope. Then the relationship becomes very robust in countries that have the ability to adopt some of the innovations created by the developed world. As we have seen, a reason for this robustness might be that here the reverse causality is strongest. Again, this can be fitted by a linear function, maybe with a short transition phase. In the developed world the IQ-GDP relationship again loses strength, because all these countries not only create new innovations, but additionally are capable of immediately adopting any innovation by the other developed countries.

But why is this a better interpretation than the exponential fit?

We have seen that the exponential fit improves the overall correlation significantly. The three section theory says, that this is an artefact of the positioning of the three sections and not an attribute inherent to any of the sections.

The preindustrial section has a significant IQ-GDP correlation of 0.469, the exponential fit reduces it to 0.418. The developed section has a significant correlation of 0.599, which is reduced to 0.566 by the exponential fit.
Only the middle income section sees a slight increase of the correlation from 0.780 to 0.805. And even that slight curving might be explained away by these sections not being completely pure.

What the three section theory tells us, is that for preindustrial countries an IQ point is worth just 125 dollars. For the middle income countries its 1488 and for the developed countries 1886. The difference between the developed countries and the middle income countries is in that respect smaller than it seems, because the line of best fit in the developed world is not particularly robust. Instead the major difference seems to be an extra 10,000 dollars afforded to the developed countries, which may be due to being ahead of the curve in technology.

IQ-GDP VI: The Contribution Distribution

One of the interesting aspects of the smart fraction theory is that it explicitly provides a “contribution distribution”. This is a function, that details how much each section of the bell curve contributes to the economy. In the smart fraction theory, this function is a step function, which is zero below the threshold (IQ=106) and some constant value above zero beyond the threshold. This can obviously only be a crude approximation of the true contribution distribution.

So, what is the true contribution distribution?

We can try to approximate the true contribution distribution by splitting the IQ spectrum into several sections and finding out for each country, how big the percentage of the population in each section is. Together with the GDP values, this gives us a system of linear equations, where the sum of (percentage of the population * contribution of IQ section) = GDP, for all countries.

Unfortunately, solving this equation doesn’t give us a sensible contribution distribution. The smart fraction theory already showed us, that assigning a GDP value to a single IQ section is enough for an excellent fit. Giving this equation more degrees of freedom just ends up with contribution values all over the place.

However, we can also infer the contribution distribution directly from the exponential function fitted to the data. By either using fancy math or basic logic, we conclude that the contribution distribution connected to the exponential fit, has the same form a*10^bx, with the same b but a different a, as the exponential function fitted to the data. (The fancy maths involves fourier transforms, the basic logic says that the contribution distribution has to rise as fast as the exponential fit.)

Fitting this function to the GDP data gives us the following contribution distribution:

Of course there are issues with the concept of the contribution distribution.

The contribution possible for each IQ segment will depend strongly on the overall economy. This global contribution distribution is bound to overestimate what smart people can do in poor societies and it might underestimate what not-so-smart people can contribute in rich societies.

The exponential takeoff looks somewhat insane. I stopped plotting at IQ=130, because otherwise it becomes ridiculous. A contribution distribution derived on the basis of the smart-fraction fit might be more realistic. However, at this point we do not really know the diminishing return on IQ.

It is also worth keeping in mind that the contribution of each segment is a mean average. It could very well be the case that the median contributions of each segment lie much closer to each other, and only the increasing number of massive outliers in terms of contribution results in the exponential rise.

Still, the contribution distribution is worth exploring, because it allows us to go beyond mean IQ.

IQ-GDP V: Reverse Causality

The relationship between ethnic composition and GDP/IQ that we investigated in the previous blogpost, allows us to compute an upper limit of the reverse causality, that is of the causal effect of GDP on IQ. To do that we predict IQ from ethnic composition, and use that function to correct our IQ values for ethnicity. That way we remove the influence of ethnicity from the IQ data. Only the remaining IQ differences can be caused by GDP or other environmental factors.

We start again with the mainland countries of South and Middle America. The correlation between IQ and percentage of the population that identifies as white is quite strong with 0.838 (p<5.1e-5). The red line is the best fit according to least squared error. Now, by looking at the deviation of the actual IQ values from the values predicted by the white percentage, we can try to find effects on IQ apart from ethnicity.

In this case, however, we come up empty. The residual IQ values do not correlate significantly with GDP (0.25, p<0.35). This does not mean that there is no reverse causality from GDP to IQ, only that if there is any, it is hidden in a feedback loop. I.e. smart people have a strong economy, which makes them even smarter. The takeaway is still that for these countries ethnic composition explains both IQ, and via IQ, also GDP, with each IQ point being worth 1419 dollar in GDP.

The situation is quite different for the South and Middle American islands. Here, black percentage explains a large part of the IQ differences (correlation of -0.58, p<0.03). However, black percentage does not correlate with GDP. This is due to a large fraction of countries that got relatively wealthy by non-industrial means, ie. as tax havens or tourist destinations. Nonetheless, there is a correlation of 0.658 (p<0.011) between IQ and GDP!

So, ethnicity correlates with IQ. IQ correlates with GDP. But ethnicity does not correlate with GDP! This implies that the GDP-IQ correlation in this case is not caused by ethnicity. And indeed, if we control for black percentage, the IQ residual still correlates 0.644 (p<0.013) with GDP.

Here, we finally have some nice evidence for reverse causality. We can see a leveling off after 20,000 dollar. The Bahamas and Trinidad &Tobago are still on the level of Barbados, and Puerto Rico and Saint Kitts & Nevis are still on the level of Dominica etc., despite being much richer. Between 10,000 and 20,000 dollar GDP per capita there seems to be a strong effect on IQ, with every 500 dollar or so buying an IQ point.

Note, that the overall relationship of a single IQ point with GDP, as observed in the mainland countries, is almost three times as large. This should give rise to a feedback effect, where every IQ point gained, nets enough GDP to further increase IQ by two points. Consequently, countries in this zone should converge towards their ceiling. A runaway IQ effect. Which, of course, still takes generations.

IQ-GDP IV: Ethnicity

In the last post we saw that the evidence is not kind to the idea that the causal direction goes from GDP to IQ in the observed relationship. However, this does not yet establish, that the causality goes into the opposite direction. In theory, there are two other possibilities to take into account.

One, there might be a third variable that is causally influenced by both GDP and IQ. If we somehow unwittingly controlled for this variable, while collecting the GDP and IQ data, we would have introduced a spurious correlation. This seems to be extremely unlikely for our data.

Two, it is possible that there is an a third variable that influences IQ and that is not causally influenced by GDP, such as “industrialisation”. If industrialisation increases IQ, but just being wealthy does not, it would be small wonder that we see no IQ increase in countries that have gotten rich by different means.

However, if we can explain a big portion of the IQ differences with a different variable, whose value has been fixed before environmental influences like industrialisation could have worked their magic, this kind of confounding becomes very unlikely.

So, here we go one step deeper and take a look at the ethnic makeup of different countries.Todays percentages of different ethnic groups in the countries we are going to investigate are overwhelmingly due to immigration that happened many generations ago, sometimes hundreds of years. If we can explain some of the IQ and GDP differences via ethnic composition, it seems quite unlikely that they are caused by environmental influences.

In South and Middle America the percentage of people who identify as “white” correlates 0.66 (p<0.0054) with GDP and 0.838 (p<5.06e-05) with IQ. (Given that the newest database contains gems like an IQ below 50 for Nicaragua, we use Rindermann’s IQ database, which is based on educational assessment studies. Those have fewer of the problems with sampling and Flynn effect correction that the pure IQ studies are prone to. We also exclude all Islands. Mostly because avoiding modelling black percentage as well is simpler. The information of white self-identification was mostly collected from the respective wiki-articles and is based on census information.)

If we just look at the Islands, IQ and black percentage correlates -0.585 (p<0.028).

In South-East Asia the percentage of Chinese per country [1] correlates 0.9948 (p<3.154e-08) with GDP per capita and 0.858 (p<0.003016) with mean IQ. Of course, here the high values are driven by the outlier Singapore, but at least the insane GDP-Chinese correlation hardly diminishes if we exclude Singapore.

In Africa, there are several countries, that have a small white minority [2]. These are descendants of white settlers from up to 400 years ago. If you plot the percentage of white Africans against GDP, there is no correlation. However, the outliers are systematic. If we exclude Botswana, which is wealthy due to diamonds and other minerals, as well as Gabon and Equatorial Guinea, two neighboring states rich in oil, the picture changes significantly.

Among Sub-Saharan countries, which do not depend strongly on natural resources, the white percentage correlates 0.86 (p<0.00065) with GDP. This is really astonishing, because the overall percentages are so small. Also, the remaining outlier Mozambique can likely be explained by a long civil war (1977-1992) and lingering political instability.

This data implies that ethnic composition has a lot of explanatory power when it comes to GDP differences. Because the ethnic composition was mostly determined hundreds of years ago, it seems likely that it causally drives GDP differences. Our previous investigations and the correlation between IQ and ethnic composition suggest, that the causal connection between ethnic composition and GDP is at least partially mediated by IQ.

[1] Chinese diaspora
https://en.wikipedia.org/wiki/Overseas_Chinese

[2] White Africans
https://en.wikipedia.org/wiki/White_Africans_of_European_ancestry

IQ-GDP III: Causality

Lynn and Vahanen’s “IQ and the wealth of nations” is extremely controversial for two reasons: It reports very big differences in average IQ between nations and it implies that these differences matter for economic success. This goes against two cherished dogmas in the Western world: That all peoples are equally capable and that the poor countries are poor due to the vagaries of geography/history and the perniciousness of the imperialist West.

People were quick to point out, that the correlation observed between national IQ and GDP does not prove a causal connection from high IQ to economic success. While it is plausible that smarter people are more economically productive, it is also true that being poor is coupled with malnutrition, disease and lack of education, all of which are known to suppress IQ. The Flynn effect is a powerful proof, that populations who reduced all these negative factors, also see large IQ rises.

If causality can go either way, the best way to find out the truth would be an intervention study. Just choose several countries that are culturally and ethnically similar and also have a similar history. Then randomly select half of these countries to receive a huge external boost to their GDPs. After a few generations we check whether increasing GDP has increased IQ and to what degree.

This is basically the story of the Arab league [1].

The Arab league consists of 22 members, with GDP per capita ranging from 2300 dollar for Yemen to 124,529 dollar for Qatar. The clear GDP divide isn’t between the sand Arabs and the oil Arabs, but rather between the gulf states that have (or in the case of Bahrain: had) oil in such abundance, that they all are at least twice as rich as the best of the rest.

The gulf states in blue, the rest in red.

For 16 of these 22 countries I possess IQ and GDP data. The GDP data is from 2017 and none of the mean IQ values are estimated from neighbouring countries. This is done for some countries in the database, but it would be fatal for our current endeavour.

So let’s see whether our intervention had the desired effect:
The average IQ of the poor Arabs is 83.8 while the average IQ of gulf Arabs is 82.6.

That looks rather like wealth has a slightly negative effect.

But maybe it is a specific cultural thing that the GDP-IQ relationship doesn’t hold in Arab countries?
Well, in fact the correlation of IQ and GDP among the non-gulf Arab states is 0.754 with p<0.011. It is only when we add the gulf states to the mix, that the correlation completely vanishes.

If the causal direction was from GDP to IQ, we would expect the correlation to get stronger as we add countries that got rich via natural resources, finance shenanigans or other windfall, because this increases the range of GDP values.

If the causal direction goes from IQ to GDP, we expect to see the opposite. The correlation would be strong in subsets of countries that earn money via industrial production and would weaken when we add countries that got rich in a more random fashion. This is what we observe in the Arab countries. But it actually holds all over the world, except in Africa. Possibly, because only in Africa malnutrition and disease is so bad and industrial production so non-existent, that the causal direction from GDP to IQ is stronger than in the other direction.

Correlation and p-value changes, when we filter communists, tax havens, tourist destinations and countries rich in natural resources, from unfiltered to filtered:

Americas: (0.57, 0.0018) –> (0.78, 0.00022)
Asia: (0.23, 0.155) –> (0.849, 0.00024)
Europe: (0.497, 0.0097) –> (0.727, 0.017)
Africa: (0.65, 9.741e-06) –> (0.57, 0.0025)

I used data freely available on wikipedia (or sources like worldbank) to determine which countries is either ex-communist [2], or a tax haven [3] or gets a substantial percentage of GDP from tourism or natural resources. So my filtering is a pretty blunt instrument. The effect would probably be even stronger if I checked whether a country is actually rich in the context of the region, and only then looked for a non-industrial reason.

I also want to disclose that depending on which IQ database one uses, the Americas correlation can see a minimal drop after filtering. Given the developmental status of South and Middle America, this doesn’t impact the argument. And in fact we are going to take a close look at South and Middle America in the very next blogpost.

[1] The Arab league
https://en.wikipedia.org/wiki/Arab_League

[2] Communist states
https://en.wikipedia.org/wiki/Communist_state

[3] Tax havens
https://en.wikipedia.org/wiki/Tax_haven

IQ-GDP II: Curve fitting

Systematic outliers

GDP is a flawed measure, but it is a very popular one. We choose it to represent wealth production per nation to establish continuity with preceding investigations. Of course, the mean national IQs, introduced in the last post, also correlate with GDP per capita (0.6167787349944118, p<1.4581315729112548e-16). In this post we are going to take a closer look at this relationship.

In the figure above, we can see an upward sloping curve described by the bulk of the data points. But there is also no shortage of outliers. Now, sometimes outliers are just noise and the only honest way to remove them is to get better data. Most of our outliers here are systematic. They group into countries that are biased in the same direction and for the same reason.

The gulf states (QAT,KWT,ARE,SAU,BHR,OMN) stand out with their IQ in the 80ies and very high GDP. Obviously, their high GDP is due to oil. China and several ex-communist countries are still catching up after decades of planned economy. The North-East Asian countries are too smart for their GDP. It seems to be the case that their unusually high mathematical-spatial IQ exaggerates their full-scale IQ or whatever aspect of IQ is essential for the GDP-relationship. If we wanted to get at the underlying relationship that drives that bulky upward sloping curve in its purest form, we might want to exclude countries rich in natural resources, tourism or tax haven fueled economies, (ex-)commies and the North-East Asians.

That leaves us with roughly half the countries, and we can claim that we examine the relationship between national IQ and GDP in non-North-East Asian countries, whose economy is based on the industrial production of goods in a market economy.
Here, we still see some outliers: The USA (maybe the dollar), Puerto Rico (due to being part of the US), South Africa and Namibia (we’ll see why in a later part of this series) and Panama (no idea why).

Fitting a curve and telling a story

The Pearson correlation we calculated above, assumes a linear relationship. In case of a non-linear relationship the correlation undersells the actual connection between the variables. Finding a fitting function for the curve described by our datapoints allows us to correct for that.

There are different ways to fit this curve and they come with different narratives.

La Griffe Du Lion proposes the smart fraction theory of IQ [1]. According to his theory, GDP is directly proportional to the size of the fraction of the population above a certain IQ-threshold. This theory entails that GDP gains would level off once most of the population is above the IQ-threshold. The threshold that fits our filtered data (70 countries) best is an IQ of 106. This results in a correlation between the size of the smart fraction and GDP of 0.932, p<8.15e-32.

Richard Dickerson proposes an exponential fit of the form a*10^(b*IQ) [2]. This results in a virtually identical fit with a correlation of 0.931, p<1.875e-31. The story changes somewhat, however. There is no reason to expect a leveling off of the curve and no smart fraction gets to play an essential role.

While these two ways of fitting the data come with different narratives and predictions, they both show that the IQ data explains the vast majority of the variation in GDP produced by industrial production of goods in a market economy.

I have another two competing theories how to fit the data. However, we first have to cover more important ground. In the next post, we are going to look at the question of causality.

[1] The smart fraction theory of IQ and the wealth of nations
http://www.lagriffedulion.f2s.com/sft.htm

[2] Richard E. Dickerson: Exponential correlation of IQ and the wealth of nations.
https://www.sciencedirect.com/science/article/pii/S0160289605001078

IQ-GDP I: The database

The database

In 2002 Richard Lynn and Tatu Vahanen published “IQ and the Wealth of Nations”, a book based on a database of national mean IQ scores collected from many different sources [1]. This has made a lot of people very angry and been widely regarded as a bad move.

There are a lot of studies that measure the IQ of their probands, often as only one of several indicators. A typical example would be trying to establish the adverse effects of malaria. Here, you would have a group of people afflicted with malaria and a control group representative of the population. By comparing both groups in IQ, SES, health and what-not, you can establish that malaria is a bad thing to happen to you.

Now, Lynn comes along and doesn’t give a damn about malaria. Instead he just scoops up the mean IQ of the control group, which gives him one measurement of the typical IQ of this population. However, due to the Flynn effect, you cannot easily compare IQ across time in a fair way. So if the IQ test used, was normed ten years earlier, say in the UK, you have to discount this mean IQ by the Flynn effect over ten years in the UK. This would amount to roughly -3 points and gives you a comparison of this population and the British in the year of the study in terms of IQ.

This results in a database that is easy to criticize. Many of these studies are not very carefully conducted, after all, they were never meant to create representative mean IQs of a national population. The Flynn effect is not well understood and correcting for it can seem arbitrary and a little dodgy. However, this database now exists and it is still maintained and improved by one David Becker [2] and, as we will see, it contains very interesting information.

The correlations

But how do we tell, that this offensive database is not just noise?
Well, for starters the national IQs correlate very significantly and quite strongly with

  • human development [3]: correlation 0.821, p< 1.165e-36
  • economic complexity [4]: correlation 0.789, p<1.329e-24
  • scientific output [5]: correlation 0.618, p<1.040e-17

and very significantly and negatively with

  • inequality [6]: correlation -0.481, p<1.485e-08
  • infant mortality [7]: correlation -0.809, p<2.581e-33
  • corruption [8]: correlation -0.602, p<2.136e-15

This shows that the database does not contain “just noise”. There is actual information in there, about stuff we usually care a lot about. Of course, many very different relationships can result in a correlation between two variables. Over the next posts we are going to go deep on one of these relationships: The one between national mean IQ and GDP per capita.

[1] Lynn, Vahanen: IQ and the Wealth of Nations
https://en.wikipedia.org/wiki/IQ_and_the_Wealth_of_Nations

[2] World’s IQ by David Becker
https://www.researchgate.net/project/Worlds-IQ

[3] Human Development Index
https://en.wikipedia.org/wiki/Human_Development_Index

[4] Economic Complexity Index
https://en.wikipedia.org/wiki/Economic_Complexity_Index

[5] H-Index
https://en.wikipedia.org/wiki/H-index

[6] Gini-Coefficient
https://en.wikipedia.org/wiki/Gini_coefficient

[7] Infant mortality rates
https://en.wikipedia.org/wiki/List_of_countries_by_infant_and_under-five_mortality_rates

[8] Corruption Perception Index
https://en.wikipedia.org/wiki/Corruption_Perceptions_Index

A theory of IQ: Cognitive profiles and cortical structures

In the last post we presented three mysteries, the relatively small brains of the highly intelligent Ashkenazi Jews, the scientific and economic underperformance of North-East Asian countries relative to their mean IQ (around 105), and the Flynn effect of rising IQ scores during the 20th century.

To arrive at a theory capable of resolving them, we will discuss first the Ashkenazi cognitive profile and then a simplified model of the neocortex.

The Ashkenazi cognitive profile

Freud, Einstein, Marx.

Often most impressive about famous Jewish thinkers is their ability to put a lot of different and seemingly unrelated facts into a big conceptual framework. Sometimes that results in nonsense, sometimes in pure genius, and sometimes it changes the world.

It also seems to be the driver behind the crazy percentage of Nobel prizes in economics collected be Ashkenazim. A slightly uncharitable description would be that Ashkenazim seem to have a unique ability to create just-so stories. Examples for this ability are easy to come by [1],[2],[3].

The IQ profile of Ashkenazim is unusual as well. They excel at mathematical and especially verbal tasks, though they seem to lag slightly behind other Europeans when it comes to visuo-spatial IQ [4].

The biological underpinning of these extraordinary abilities are suggested by the two big genetic disease clusters typical for Ashkenazim, one increases dendritic growth, i.e. the ability of neurons to form synapses with other neurons, the other hampers DNA repair, which is conjectured to also boost the number of synapses created in the brain [5].

This implies that the fast creation of new connections is the driver behind the high Ashkenazi IQ.

A cartoon model of the human neocortex

For the purpose of this blogpost I introduce a very simplified model of the human neocortex, the seat of human intelligence.

The cortex can be viewed as consisting of pattern recognizers, which have three kinds of input connections [6]: The feedforward input that contains the actual pattern uses only 20 percent of the dendritic connections of this pattern recognizer. The remaining 80% are distributed between lateral connections, which provide temporal context and therefore facilitate sequence learning, and feedback connections, which provide overall context.

A theory of IQ

My hypothesis is that the faster creation of lateral synapse boosts the verbal IQ of Ashkenazim, while easier creation of feedback connections allows for the conceptual and analytic excellence that distinguishes Jewish thinkers.

If this hypothesis is correct, the slightly lower verbal IQ of NE-Asians suggests a slightly lower number of synapses being created. An overall lower creation of feedback synapses would also lead to a lower ability to come up with creative conceptual theories. This ability is difficult to test and therefore doesn’t show up in the “lab”. But it is more plausible than verbal IQ to be the essential ingredient for economic and scientific success.

The full correspondence I suggest is that the number of pattern recognizers determines visuo-spatial and mathematical IQ. The number of lateral synapses corresponds to verbal ability and the top down connectivity to the ability to create new high level concepts.

But wait a second, don’t the Ashkenazim have very high mathematical IQ as well? Quite right, and they achieve that by re-purposing part of the visual cortex for higher level patterns. Basically evolution just shuffled IQ points from spatial to mathematical, by reassigning pattern recognizers.

With that last little flourish everything falls nicely into place, the IQ profiles, the brain sizes, the underperformance relative to IQ.

The Flynn effect can now be explained by brain size increase via better nutrition and fewer childhood diseases [7],[8]. This fits perfectly to a puzzling aspect of the Flynn effect, namely that the gains have been enormous on pure pattern recognition tests, like the Raven’s, while IQ tests based on sequence learning, like verbal IQ or digit span have shown little or no Flynn effect.

If the half a standard deviation bigger NE-Asian brains do a standard deviation better on spatial reasoning/maths than European brains, it is not unreasonable to assume that the increase in brain size by more than a standard deviation [7],[8] during the 20th century might account for the whole Flynn effect on the Raven’s which is more than 30 points.

Of course, the brain is lot more complicated than my simple model suggests. The hippocampus, the basal ganglia, the thalamus, etc. all likely play a essential role in human intelligence. The Flynn effect might have several additional causes, especially education seems to be a candidate that shouldn’t be neglected. However, as a very rough overview, this seems to be a useful framework.

[1] Guns, Germs and Steel
https://en.wikipedia.org/wiki/Guns,_Germs,_and_Steel

[2] Legal systems very different from ours
http://www.daviddfriedman.com/Academic/Course_Pages/legal_systems_very_different_12/LegalSystemsDraft.html

[3] Unsong
http://unsongbook.com

[4] Cognitive Style of Eastern European Jewish Males
https://journals.sagepub.com/doi/abs/10.2466/pms.1977.45.1.279

[5] Natural History of Ashkenazi Intelligence
http://web.mit.edu/fustflum/documents/papers/AshkenaziIQ.jbiosocsci.pdf

[6] Cortical Learning Algorithms
https://numenta.org/resources/HTM_CorticalLearningAlgorithms.pdf

[7] More evidence for increasing brain size over the 20th century
https://pumpkinperson.com/2018/08/25/more-evidence-for-increasing-brain-size-over-the-20th-century/

[8] Human brain growth in the 19th and 20th century.
https://www.ncbi.nlm.nih.gov/pubmed/372500